Complementary indicators to MOGALEF Bands
For a better understanding of the market behavior MOGALEF bands come with other useful indicators EMA20, EMA150 and RET90. We will describe their use later on.
We will also find some optional indicators very useful for trading.
The Retracement 90 (RET90)
It is a tool for trend and impulsions monitoring. The RET(90) completes the MOGALEF Bands by providing a very interesting horizontal level. It indicates the long term equilibrium level on which traders can find a support.
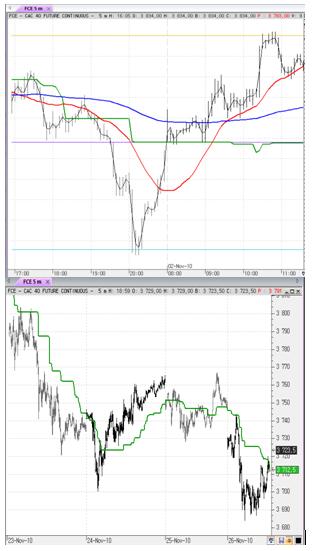
The Ret90 calculates the middle of the range of the 90 bars preceding the current bar. This is the way it is calculated:
90 periods High + 90 periods Low/2
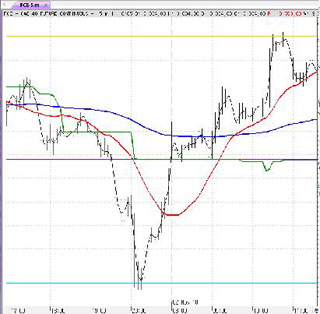
Exponential Moving Average 150 (MME150)
It provides a long term level complementary to RET(90). This way, we can define a neutral or equilibrium zone (non-trending zone) with these two indicators.
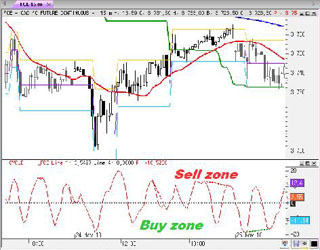
Medium Term Weighted Stochastic (STPMT)
This tool provides both the market timing and direction. The STPMT is red and its moving average blue. The dotted lines are the components of the STPMT.
The oscillations of the STPMT around its moving average 9 (in bleu) define the timing. The orientation of the successive oscillations, indicate the direction. The STPMT remains in high zones over the bullish trends and in low zones over the bearish trends.
The bullish and bearish divergences of the STPMT are automatically drawn on the chart. They normally represent strong points where the market cold pause for a while or change its direction.
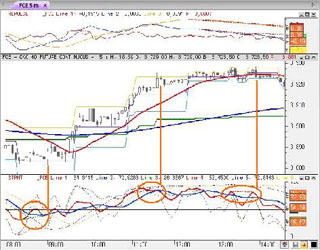
The STPMT with divergences
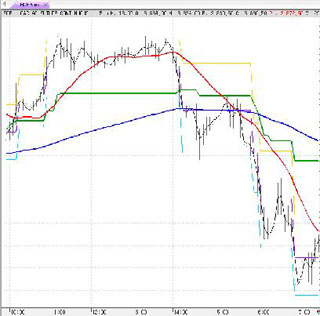
The Cycles
This is a timing tool which enables to select favorable moments to buy or sell.
These cycles are issued from the STPMT and provide an easier vision of the timing.
The bullish and bearish divergences have been automatically drawn on the chart. They are not really significant unless they are associated to other divergences.
Cycles and divergences
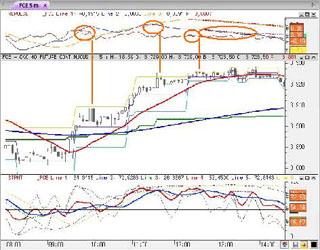
The Repulse
The Repulse is a tool for impulses and trend monitoring. He often provides live information on the possible obstacles (support/resistances) that prices can find on their way. When they divergences appear the trader must take a decision, close the position, cover it or exit half of the position.
The Repulse(1) in red examines the impulses and the short duration linear movements.
The Repulse(5) in blue examines the successive oscillations, the waves.
The Repulse(15) the long duration trends.
No matter what his position is, the trader knows if he must be careful with the prices evolution or if, on the contrary, he can keep his positions safely.
The bullish and bearish divergences are automatically drawn on the chart
|
|
|